Search the GSQ Open Data Portal for maps
Permit and geoscience maps published by Queensland Government can be searched for from the Map collection layers.
The map collection layers are available from Topics and the GSQ Open Data Portal group within the layers menu. In this example we will look at loading the layers from the Topic.
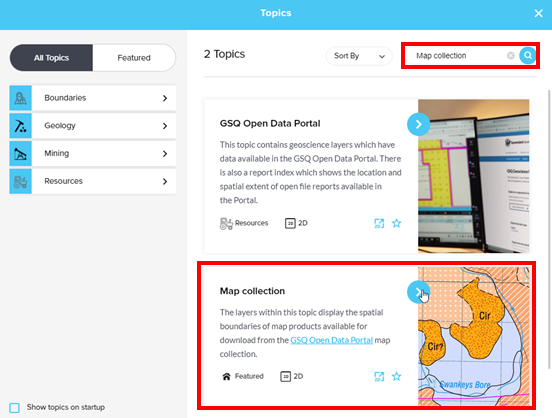
Click the Topics button on the top left.

Click on the magnifier button to search for a topic. Type map collection and press enter. You can now see the map collection topic. Click on the arrow to view more information.
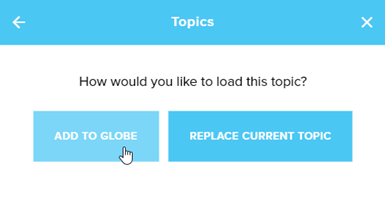
Select Launch Topic and Add to globe then wait for a moment as the layers load on your map.
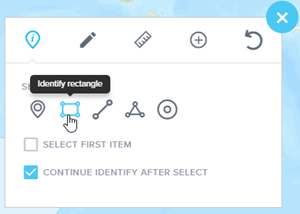
Zoom into an area of interest to display the map index boundaries on screen. Click on the spanner to open the toolbar and select the i to open the identify tools. Choose a shape to identify with, for this example we’ll use the rectangle.
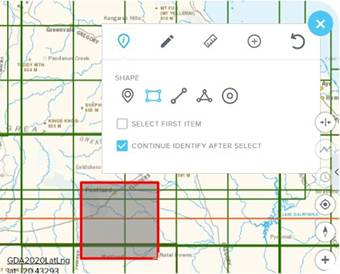
Click and drag the mouse to draw a box over an area of interest. The maps available in this area will then be listed in the results table panel at the bottom of the screen.
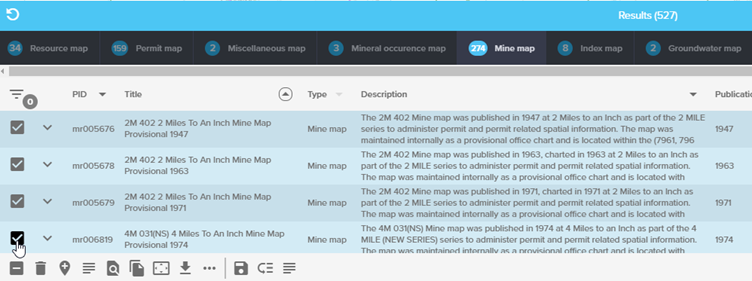
The layers are divided into map product types including: Atlas, Gemfields, Geochemistry, Geology, Geophysics, Groundwater, Index maps, Industrial rock, Mine maps, Mineral occurrence, Miscellaneous, Permit and Resource maps.
Click on one of the map types in the results table to view the attributes.

Select some maps from the table using the checkboxes. (The maximum number of features that can be selected to search the Portal at one time is 600).
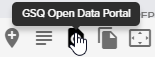
Click on the GSQ Open Data Portal button  (bottom of the results table) to search for these maps in the portal.
The GSQ Open Data Portal will then open in a new tab with the corresponding map products displayed.